The Normal Probability Curve (NPC)
STATISTICS IN PSYCHOLOGY
1/12/20252 min read
The Normal Probability Curve (NPC), commonly known as the normal distribution or bell curve, is a fundamental concept in statistics and probability. This curve represents the distribution of data points around a mean (average) value, with data falling symmetrically on both sides. The shape of the curve is “bell-like,” indicating that most values cluster around the central peak, with fewer values found as they move away from the mean. This concept is crucial in statistics, as many natural phenomena and human characteristics—such as height, IQ scores, or test results—tend to follow a normal distribution pattern. The normal curve helps us understand the probability of outcomes and is used in a wide range of fields like psychology, economics, and biology.
Objectives of the Normal Probability Curve
The main objectives of studying the normal probability curve are:
Understanding Data Distribution: The normal curve shows how data points spread around the mean, displaying the common pattern of data in many real-world situations.
Estimating Probabilities: NPC helps to predict the chances of different outcomes, letting researchers and statisticians make predictions based on probability.
Assessing Data Variability: The curve reveals data variation, with the spread (or standard deviation) showing how much values differ from the mean.
Standardising Scores: By changing raw scores to standardized scores (z-scores), we can compare data from different distributions and see where each score fits within a larger distribution.
Supporting Hypothesis Testing: The normal distribution forms the basis for hypothesis testing, helping to check if a sample belongs to a population.
Assumptions of the Normal Probability Curve
Several assumptions underlie the use of the normal probability curve:
Symmetry around the Mean: The normal curve assumes data spreads on both sides of the mean, creating a mirror image on each side of the center.
Unimodal Distribution: The curve has one peak at the mean, with the mode, median, and mean all sitting at the center, showing the most common value in the dataset.
Asymptotic Nature : The tails of the normal curve get close to but never touch the horizontal axis. This shows that values at the far ends of the distribution are uncommon but can happen.
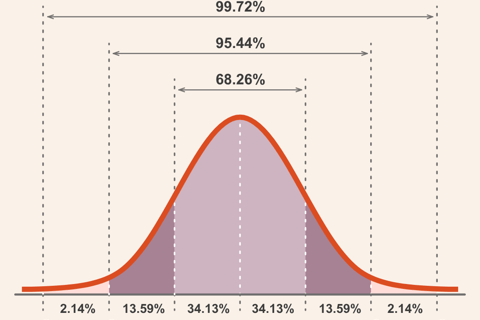
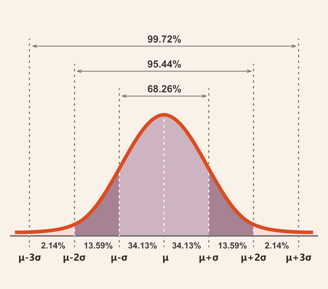
Consistent Spread: A set percentage of data (about 68% within one standard deviation, 95% within two, and 99.7% within three) falls within a specific number of standard deviations from the mean, showing how values spread out predictably.
Application of the Normal Probability Curve
The normal probability curve (NPC) has an impact on many fields because it adapts well and predicts outcomes.
Education and Psychology: The bell curve plays a key role to score tests and assessments. For standard tests, student scores often spread out along a bell curve, which lets teachers gauge how well students do compared to others.
Business and Economics: In market studies, customer info tends to follow a bell shape. To grasp this helps firms to predict how customers act, what they buy, and what they might want making the bell curve useful to plan ahead.
Health and Medicine: NPC aids medical experts to check health stats like blood pressure or cholesterol, which form a bell shape. This helps to spot and foresee health risks.
Quality Control: Factories use the bell curve to keep an eye on how good and alike their products are. By looking at how product sizes differ, companies can keep high standards and find odd items.